Popular Volatility Indicators in the Stock Market
Volatility is a key aspect of trading significantly influencing investor decisions in the ever-changing stock market. Derived from the Latin term “Volatilities” meaning “fleeting” or “transitory” the term aptly captures the sudden and unpredictable nature of price fluctuations within the market. Just as weather forecasts prepare us for changing conditions, volatility indicators empower traders to make informed decisions amidst market unpredictability.
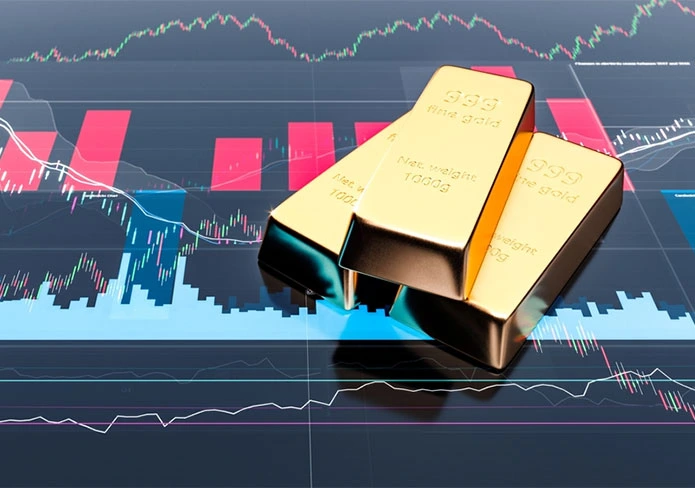
In trading, understanding volatility is essential for identifying the right moments to buy or sell. High volatility signals risk, but it can also present opportunities for savvy investors. In contrast, low volatility indicates market stability but can hint at investor complacency, potentially indicating market peaks. Whether engaging in stock market volatility analysis or trading in gold traders can align their strategies with current market conditions by analyzing volatility. In this article we orient you to the basics of volatility and the popular volatility indicators in the stock market.
Low vs. High Volatility
Volatility refers to the degree of price variation for a financial asset over time. Simply put, it measures how much an asset’s price fluctuates. Volatility is categorized as either low or high.
- Low Volatility occurs when an asset’s price remains relatively stable experiencing minimal fluctuations. This scenario is typically associated with steady, lower-risk investments.
- High Volatility involves substantial price fluctuations over short periods. While this increases risk, it also offers traders opportunities to profit from these rapid price changes.
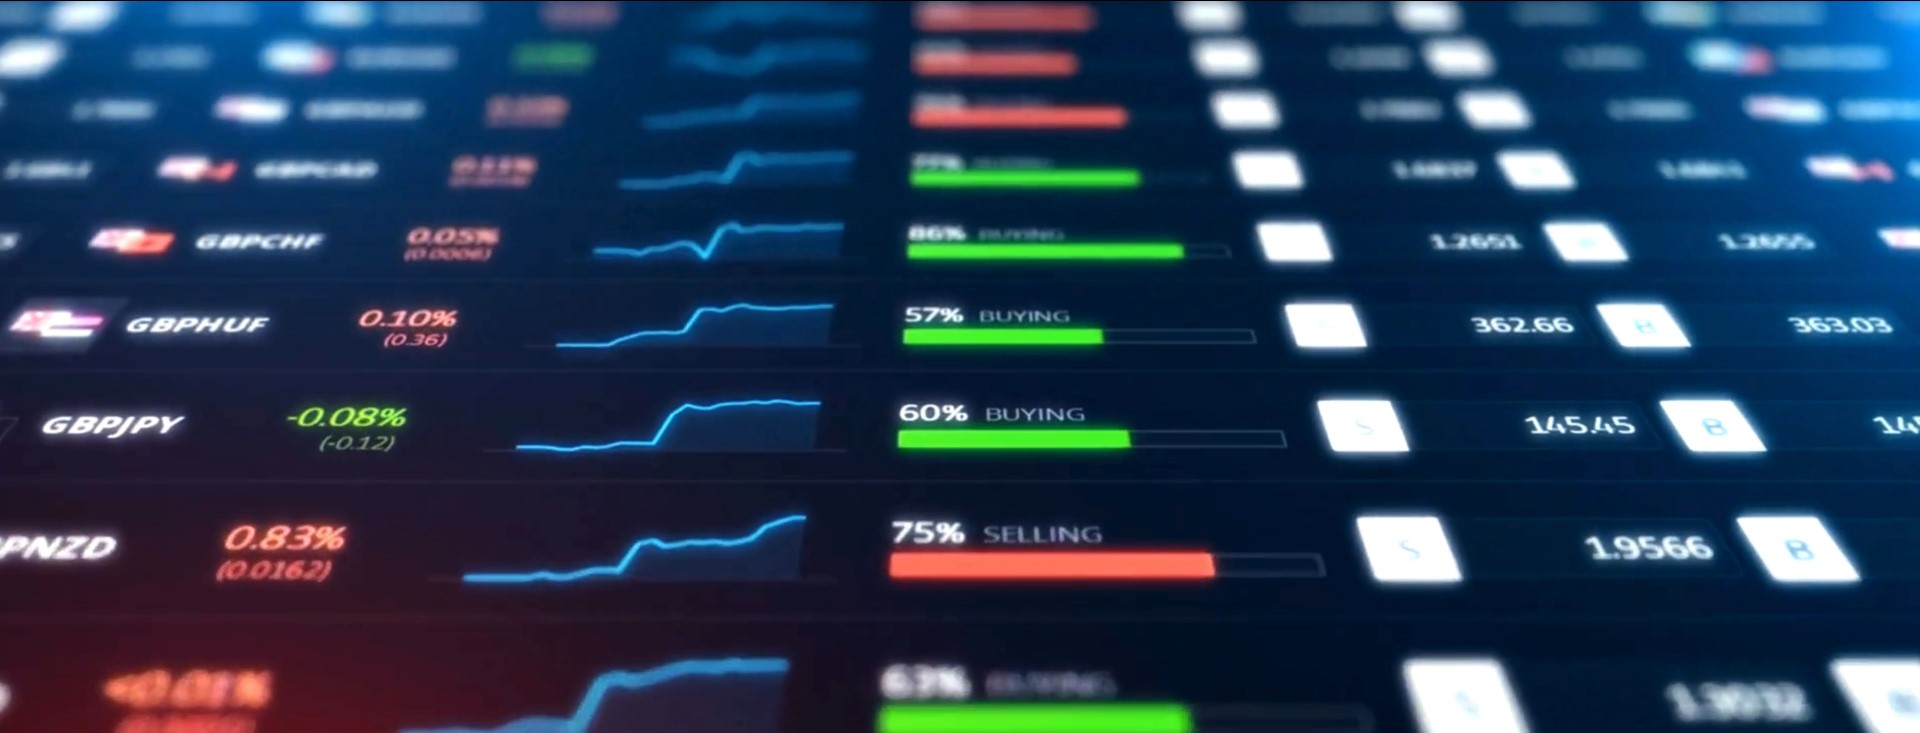
Traders assess volatility in the forex market using standard deviation, which quantifies how much a currency pair’s price varies from its average over a set period. Grasping this helps traders craft strategies that match current market conditions, whether trading forex in Dubai or utilizing top trading platforms in the UAE.
Top volatility indicators in the stock market
Several key indicators help traders measure and understand volatility in the stock market. Here are four of the most popular volatility indicators:
Average True Range (ATR)
The Average True Range (ATR) is a technical indicator that quantifies market volatility by calculating the average range between the highest and lowest prices over a specified timeframe. A higher ATR suggests increased volatility, while a lower ATR indicates stability.
Traders frequently use ATR to set stop-loss levels and pinpoint potential breakout opportunities. E.g a rising ATR might signal heightened market volatility, prompting traders to adjust stop-loss levels to avoid premature exits. As a versatile tool, ATR integrates seamlessly into trading strategies and offers valuable insights into market behavior.
Bollinger Bands
Bollinger Bands are a popular tool for analyzing volatility. They consist of a middle line representing the 20-day simple moving average (SMA) and two additional lines that are two standard deviations above and below this average. The distance between the bands widens during periods of high volatility and narrows during low volatility.
Traders use Bollinger Bands to identify potential overbought or oversold conditions. When the price touches the upper band, it may indicate that the asset is overbought, while touching the lower band could signal an oversold condition. This visual representation helps traders make informed decisions about entry and exit points based on market trends.
Donchian Channels
Donchian Channels are a volatility-based indicator that helps traders identify trends and potential breakouts. This indicator is created by taking the highest high and lowest low of a specified number of periods. The area between these highs and lows forms the channel.
When an asset is trading within the channel without significant deviations, it suggests low volatility and a lack of clear direction. Conversely, a breakout above the upper channel can signal a buying opportunity, while a drop below the lower channel may indicate a sell signal. Traders use Donchian Channels to set entry and exit points based on price movements relative to these boundaries.
Cboe Volatility Index (VIX)
Created by the Chicago Board Options Exchange (CBOE) the Cboe Volatility Index, known as VIX, is one of the most closely watched measures of market volatility. Calculated using an option-pricing model, the VIX reflects the expected volatility of the S&P 500 Index over the next 30 days. It is often referred to as the “fear index” because it tends to rise during periods of market uncertainty.
The VIX typically ranges between 12 and 35. Values above 30 mean there’s more volatility, while values in the low teens indicate stability. Traders use the VIX to understand market sentiment. When the VIX rises, it suggests the market might be heading for a downturn, while a falling VIX indicates stability. Various financial instruments, including futures and options, can be used by traders to hedge against market volatility.
Whether you’re a seasoned investor or just starting out, understanding volatility is crucial for trading. By distinguishing between volatility, trend, and momentum, traders can navigate the unpredictable waters of the market with confidence. By following volatility indicators, you can enhance your trading strategies and steer toward financial success in the stock market. If you are looking for stock brokers in Dubai, stock market volatility analysis or exploring trading platforms in UAE, learn more on how volatility indicators can optimize your trading experience.